Signal Flow Graph in Control Systems:
Signal flow graph is used to represent the control system graphically and it was developed by S.J.Mason. Signal flow graph is a diagram that represents a set of simultaneous linear algebraic equations. By differential equations governing a control system can be algebraic equations in s-domain. The signal flow graph of the system can be constructed using these equations.
It should be noted that the signal flow graph approach and the block diagram approach yield the same information.The advantage in signal flow graph method is that, using Mason’s gain formula the overall gain of the system can be computed easily.This method is simpler than the tedious block diagram reduction techniques.
The signal flow graph depicts the flow of signals from one point of a system to another and give, relationships among the signals. A signal flow graph consists of a network in which nodes are connected by directed branches. Each node represents a system variable and each branch connected between two nodes acts as a signal multiplier. Each branch has a gain or transmittance. When the signal pass through, a branch, it gets multiplied by the gain of the branch.
Must Read:
In a signal flow graph, the signal flows in only one direction.The direction of signal flow indicated by an arrow placed on the branch and the gain (multiplication factor) is indicated along the branch.
Explanation of terms used in Signal Flow Graph:
Node : A node is a point representing a variable or signal.
Branch : A branch is directed line segment joining two nodes. The arrow on the branch indicates the direction of signal flow an the gain of a branch. is the transmittance.
Transmittance : The gain acquired by the signal when it travels from one node to another is called transmittance.The transmittance can he real or complex.
Input node ( Source) : It is a node that has only outgoing branches.
Output node ( Sink ) : It is a node that has only incoming branches.
Mixed node : It is a node that has both incoming and outgoing branches.
(vii) The signals travel along branches only in the marked direction and then it gets multiplied by the gain or transmittance of the branch.
(viii) The signal flow graph of system is not unique. By rearranging the system equations different types of signal flow graphs can be drawn for a given system.
Must Read:
Signal Flow Graph Algebra:
Signal flow graph for a system can be reduced to obtain the transfer function on of the system using the following rules. The guideline in developing the rules for signal flow graph algebra is that the signal at a anode is given by sum of all incoming signals.
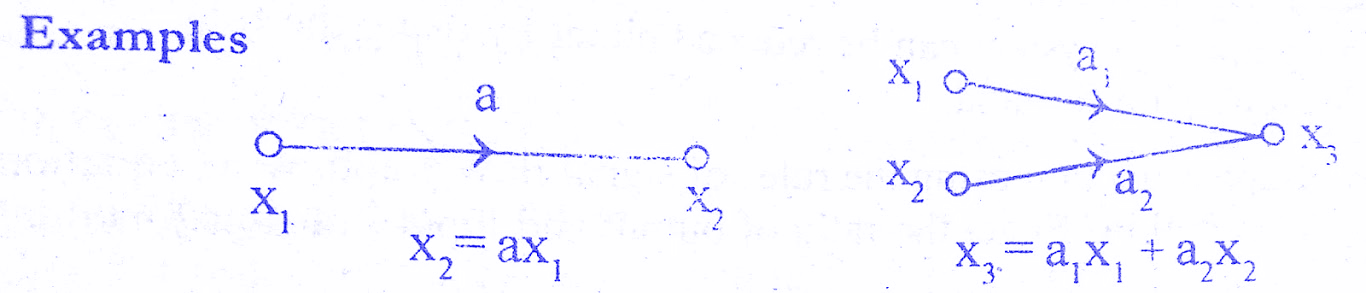
Rule 1 : Incoming signal to a node through a branch is given by the product of a signal at previous node and the gain of the branch.Check below solved examples.
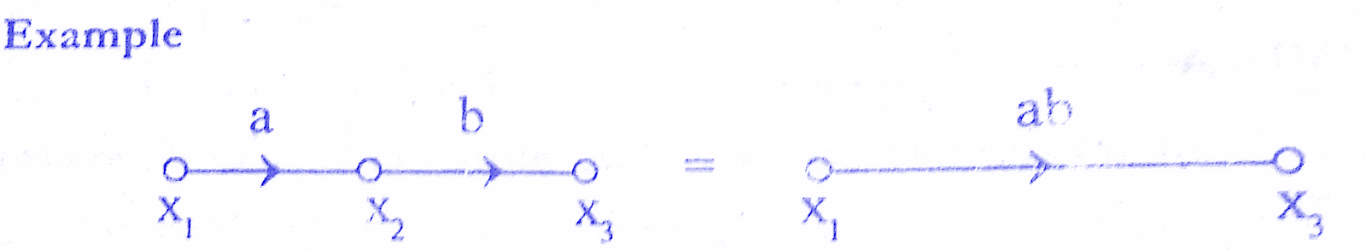
Rule 2 : Cascaded branches can be combined to give a single branch whose transmittance is equal to the product of individual branch transmittance. Check below solved examples.
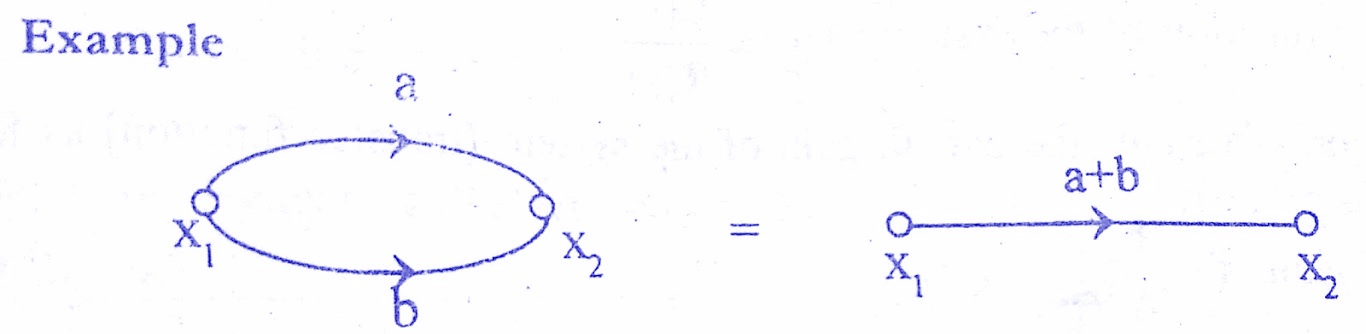
Rule 3 : Parallel branches may be represented by single branch whose transmittance is the sum of individual branch transmittance.Check below solved examples.
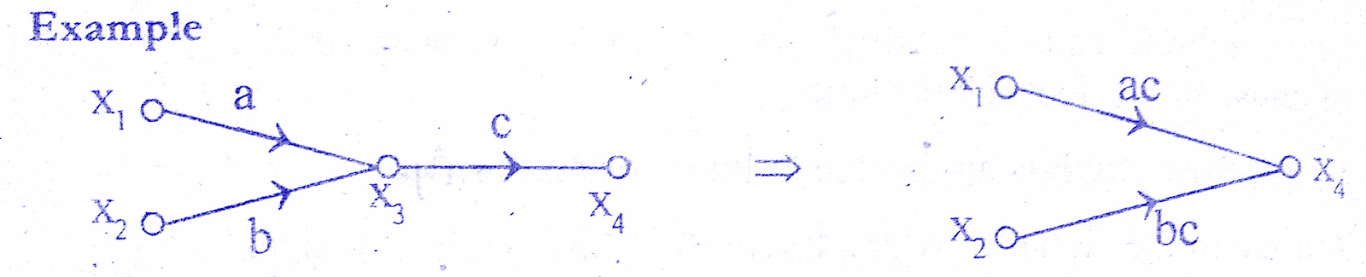
Ruled 4 : A mixed node can be eliminated by multiplying the transmittance of outgoing branch (from the mixed node) to the transmittance of all incoming branches to the mixed node. Check below solved examples.
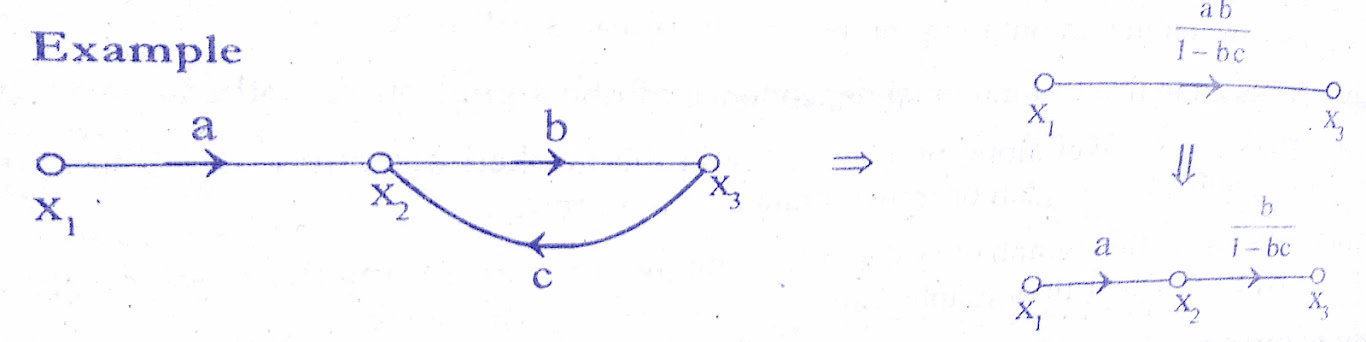
Rule 5 : A loop may be eliminated by writing equations at the input and output node and rearranging the equations to find the ratio of output to input.This ratio gives the gain of resultant branch.Check below solved examples.
Signal Flow Graph Reduction:
The signal flow graph of a system can he reduced either by using the rules of a signal flow graph algebra or by. using Mason’s gain formula. For signal flow graph reduction using the rules of signal flow graph, write equations at every node and then rearrange these equations to get the ratio of output and input (transfer function).
The signal flow graph reduction by above method will be time consuming and tedious.S.J.Mason has.developed a simple procedure to determine the transfer function of the system represented as a signal flow graph.He has developed a formula called by his name Mason’s gain formula which can be directly used to find the transfer function of the system.
Mason’s Gain Formula:
The Mason’s gain formula is used to determine the transfer function of the system from the signal flow graph of the control system.
Let R(s) = Input to the system
C(s) = Output of the system
Now, Transfer function of the system, T(s) = C(s)/R(s)
Mason’s Gain formula states the overall gain of the system [transfer function] as follows,
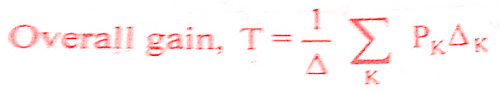
where, T = T(s) = Transfer function of the system
PK = Forward path gain of Kth forward path
K = Number of forward paths in the signal flow graph
Δ = 1 — (Sum of individual loop gains) + (Sum of gain products of all possible -combinations of two non-touching loops) – (Sum of gain products of all possible combinations of three non – touching loops)
ΔK = Δ for that part of the graph which is not touching Kth forward path
Constructing Signal Flow Graph for Control Systems:
A control system can be represented diagrammatically by signal flow graph.The differential equations governing the system are used to construct the signal flow graph.The following procedure can be used to construct the signal flow graph of control system.
1)Take Laplace transform of the differential equations governing the system in order to convert them to algebraic equations in s-domain.
2. The constants and variables of the s-domain equations are identified.
3. From the working knowledge of the system, the variables are identified as input, output and intermediate variables.
4. For each variable anode is assigned in signal flow graph and constants are assigned as the gain or transmittance of the branches connecting the nodes.
5. For each equation a signal flow graph is drawn and then they are interconnected to give overall signal flow graph of the control system.
Must Read:
Procedure for converting block diagram to signal flow graph:
The signal flow graph and block diagram of a system provides the same information but there is no standard procedure for reducing the block diagram to find the transfer function of the system. Also the block diagram reduction technique will be tedious and it is difficult to choose the rule to be applied for simplification.
Hence it will be easier if the block diagram is converted to signal flow graph and Mason’s gain formula is applied to find the transfer function.The following procedure can be used to convert block diagram to signal flow graph.
1. Assume nodes at input, output,at every summing point, at every branch point and in between cascaded blocks.
2. Draw the nodes separately as small circles and number the circles in the order 1, 2, 3, 4, ….. etc.
3. From the block diagram find the gain between each node in the main forward path and connect all the corresponding circles by straight line and mark the gain between the nodes.
4. Draw the feed forward paths between various nodes and mark the gain of feed forward path along with sign.
5. Draw the feedback paths between various nodes and mark the gain of feedback paths along with sign.
Application of Mason’s Gain Formula:
Mason’s Gain Formula finds application in various aspects of control system analysis:
Stability Analysis: It helps in evaluating the stability of a control system by analyzing the poles and zeros of the overall transfer function.
Transient and Steady-State Response: The formula aids in understanding how the system responds to transient and steady-state inputs.
Closed-Loop Systems: It enables the analysis of closed-loop systems, considering feedback and determining the effect of feedback on system performance.
Filter Design: Mason’s Gain Formula assists in designing filters by allowing engineers to analyze the frequency response of the system.
Conclusion:
In this post we have learnt Signal Flow Graph in Control Systems with Solved Examples.You can download this article as pdf,ppt.
Comment below if you have any queries!